wildfire-modeling.github.io
WildfireDB : an open-source dataset that links wildfire occurrence with relevant features
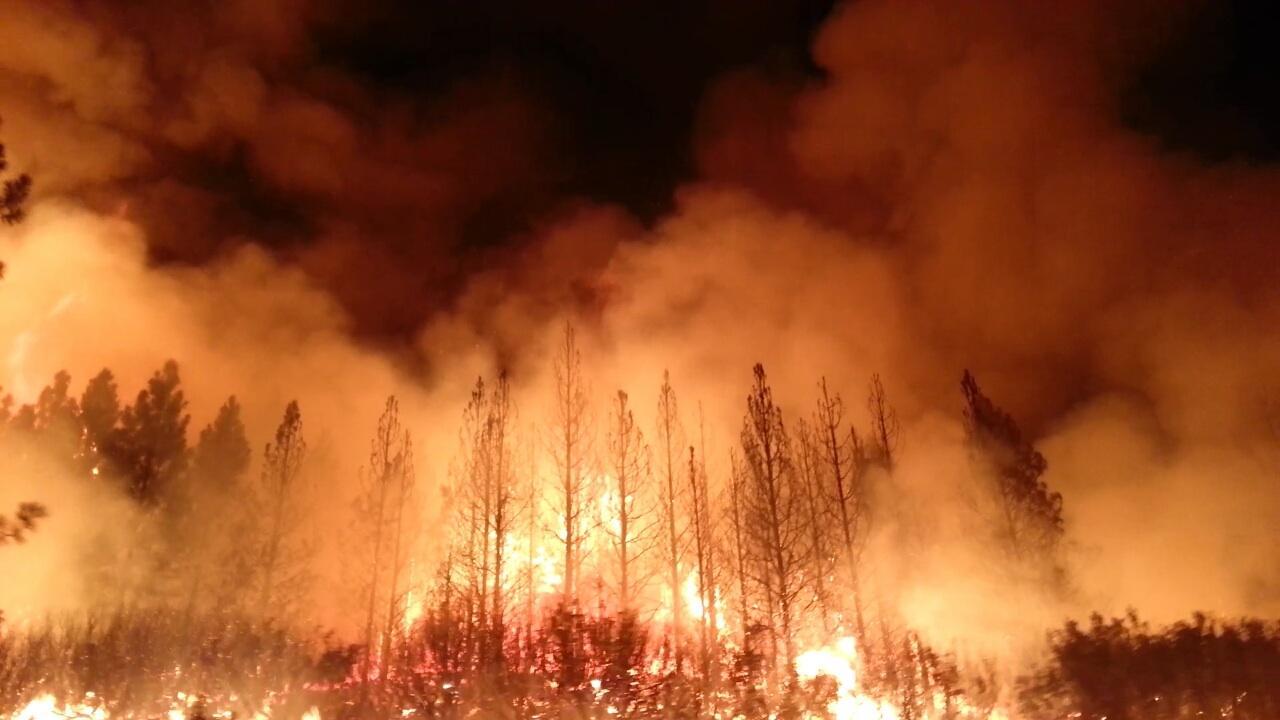
Recent wildfires in the United States, Australia, and Brazil have resulted in loss of life and billions of dollars, destroying countless structures and forests. Fighting wildfires is extremely complex. A major problem in using data-driven models to combat wildfires is the lack of comprehensive data sources that relate fires with relevant covariates. We present the first open-source wildfire dataset that combines historical wildifre occurrences with relevant features extracted from satellite imagery. Our dataset, with over 17 million data points, is created using a novel approach to process large-scale raster and vector data. The data is created and maintained by a group of researchers from Vanderbilt University, University of California, Riverside, and Stanford University.
Release Description
| Version | Release Date | Associated Publication | Location |
|---|---|---|---|
| 1.1 | June 10, 2021 | Link | Link |
| 1.0 | December 6, 2020 | Link | Link |
Currently, we have mapped historical fire data in all of continental USA through the years 2012 to 2018. Our spatial resolution is in the form of 375-meter square polygons. The temporal granularity of the data is one day. Additionally, each fire occurrence includes relevant information like type of vegetation, fuel type, and topography. The dataset can be used to learn data-driven models for fire spread as well as agent-driven approaches for fire suppression. For a description of the data, see below or use the publication links above.
Data Sources
We gather the raster dataset of vegetation, fuel type, and topography of years 2012, 2014, and 2016 from the LANDFIRE website. They are in 30-meter square cells.
The near real-time (NRT) fire occurrence data in vector form are from the Visible Infrared Imaging Radiometer Suite (VIIRS) thermalanomalies/active fire database. They are in 375-meter square cells.
We collect weather data from Meteostat, a free online service which provides weather and climate statistics around the globe. For continental USA, Meteostat collects raw data from the National Oceanic and Atmospheric Administration (NOAA). We gather aggregated daily weather data for 5,787 weather stations in the continental USA.
Data Description
In our dataset, there are 17,820,834 datapoints which are daily fire occurrences in years 2012 through 2018. Each datapoint consists of a polygon cell on fire in a time step (a day), its polygon features (more details below) and its neighbor polygon’s FRP in the next time step (next day). A zero-value in FRP indicates that its neighbor is not on fire.
The features include the cell’s current FRP (a positive value as we condition on on a fire occurring), the maximum, minimum, median, mode, sum, mode, and count values of canopy base density, canopy base height, canopy cover, canopy height, existing vegetation cover, existing vegetation height, existing vegetation type from years 2012, 2014, and 2016, as well as those of elevation and slope from year 2016. Each instance also consists of the followsing weather data – the average, minimum and maximum temperature, total precipitation, average atmospheric pressure, and relative wind speed between the two cells in consideration.
The labels are the neighbor’s FRP in the next time step in continuous values.
Data Example
| Polygon ID | Acquisition Date | FRP | Neighbor Polygon ID | Neighbor FRP | Canopy Base Density max. | Canopy Base Density min. | Canopy Base Density median | Canopy Base Density sum | Canopy Base Density mode | Canopy Base Density count | Canopy Base Density mean | ... | Neighbor Slope max. | Neighbor Slope min. | Neighbor Slope median | Neighbor Slope sum | Neighbor Slope mode | Neighbor Slope count | Neighbor Slope mean | Weather |
|---|---|---|---|---|---|---|---|---|---|---|---|---|---|---|---|---|---|---|---|---|
| 7234 | 2012-01-16 | 3.20 | 7233 | 0.0 | 0.0 | 13.0 | 0.0 | 9.0 | 1303.0 | 0.0 | 156 | ... | 37.0 | 3.0 | 17.0 | 3109.0 | 24.0 | 169.0 | 18.396450 | 12.343620 |
Data Processing
To reconcile the different spatial resolutions in the different (raster and vector) forms, we divide the state of California into a 375-meter by 375-meter grid. The center of each fire pixel from the vector data can overlap with exactly one cell. We compute the zonal statistics for the vector data using the raster data. (Zonal statistics are summary statistics calculated using a raster dataset within zones defined by another dataset, typically in vector form.) The approach is fully decentralized and does not require data to be converted from one form to another. It computes an intermediate data structure, called an intersections file, between the two file formats. Leveraging parallel computing additionally, we assemble large geo-spatial data in a tractable manner.
Publications
- We presented an initial version (release 1.0) of the dataset at the AI for Earth Sciences workshop at NeurIPS 2020. See the paper here.
- We explored how uncertainty aware wildfire management strategies can be used to suppress the spread of wildfires. Our paper, accepted at the AAAI Fall Symposium Series Workshop on AI for Social Good 2020 can be accessed here.
- A pre-print of the updated dataset can be found here.
Cite
If you want to use this data for research, please cite it as follows: “Singla, S., Diao, T., Mukhopadhyay, A., Eldawy, A., Shachter, R., & Kochenderfer, M. (2020). WildfireDB: A Spatio-Temporal Dataset CombiningWildfire Occurrence with Relevant Covariates, AI for Earth Sciences Workshop at Neurips 2020.”
Contact
For any questions or comments, please contact Ayan Mukhopadhyay or Samriddhi Singla.